
This article and all of its visualizations will help to explain the causes of death across age groups and locations.
The charts and graphics below are interactive, so make sure to click around and hover your mouse over the data to experience all the information available.You can read this guide from start to finish if you want to become an expert in death statistics.
You can also use the table of contents to jump to the section you need to reference.
Table of Contents
LEADING CAUSES OF DEATH
How many people die per day?
How many people die per day, hour, minute and second? Here are the numbers:
- Each day, 151,600 people die (1).
- That means that 6,316 people die every hour.
- That amounts to around 105 people per minute.
- This averages to around 2 people die every second.
Have you ever wondered how most people meet their end?
Just think how many people will die during the time you are reading this introduction.
In this guide, you will have a chance to study death by the numbers.
We’ll begin by reviewing the major causes of death in the United States and around the world.
This resource will go into detail about global and US catastrophes. We’ll also discuss topics such as:
- gun deaths
- workplace deaths
- deaths related to motor vehicle accidents
- drug overdoses
- and more
What are the leading causes of death in the US?
What are American's dying from?
The Centers for Disease Control and Prevention (CDC) ranked the leading causes of death and death rates in the 20th century for the United States.
The visualization chart below represents the leading causes of death in the death registration area in the United States for the period of 1900-1998. Since the visualization was produced at different times (1900-1932 and 1933-1998) and for different publications, the number of leading causes shown and formatting differ from one year to the next.
United States Death Rates in the 20th Century chart: This chart illustrates the annual death rate & causes of death in the U.S. Death rate data is based on an estimated per 100,000 midyear population.
What are the leading causes of death in the world?
Leading cause of death worldwide?
What are the leading causes of death around the world?
In 2017, more than 56 million people died, but from what? The Lancet, a world leading medical journal, analyzed the data from the Global Burden of Disease Study of 2017. The Global Burden of Disease Study provided a comprehensive picture of mortality for 195 countries & territories and 282 causes.
Worldwide Deaths by Cause Chart: This chart illustrates the GBD data of annual worldwide causes of death from 1990 to 2017.
What are the top 10 leading causes of death in the world?
What is most likely to cause your death?
All things being equal, there is a good chance that it will be one of the causes in the chart below.
We’ve ranked the Top 10 major causes of death (plus 5 more).
What are you most likely to die from?
Here are the top three ways most people will die.
- Heart Disease
- Malignant Neoplasms (tumors)
- Accidents
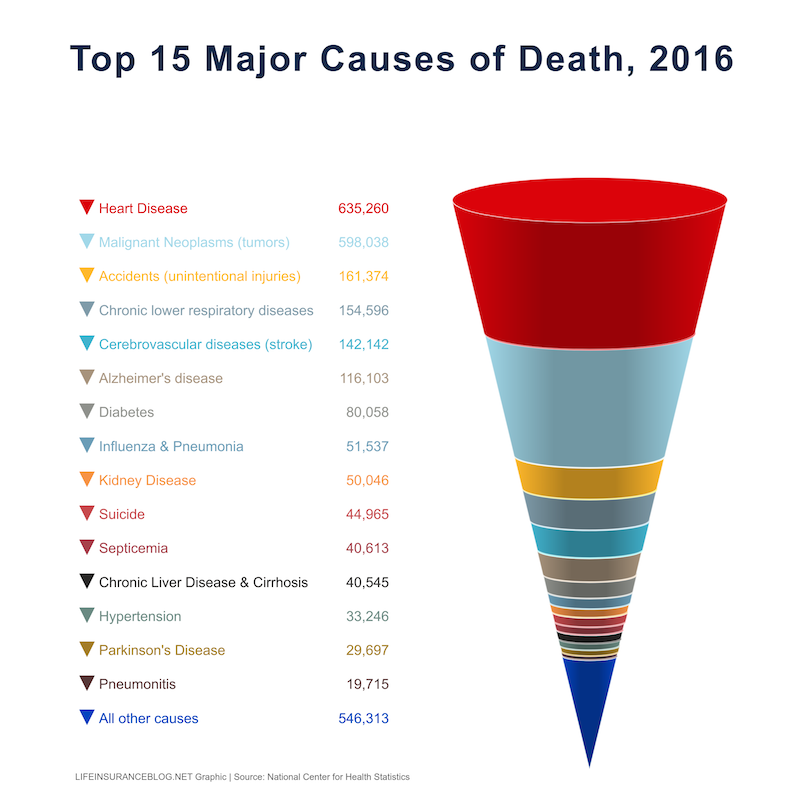
Heart disease remains the number one killer, followed by tumors and accidents. Following those, you are most likely to die from a chronic respiratory disease or a stroke.
Number 6 on the list is Alzheimer’s disease, followed by diabetes, influenza and pneumonia, kidney disease, and suicide.
These facts and figures are adjusting rapidly to changes in the world.
The Alzheimer’s Association points out, “Between 2000 and 2017, deaths from heart disease have decreased 9% while deaths from Alzheimer’s have increased 145%. 1 in 3 seniors dies with Alzheimer’s or another type of dementia. It kills more than breast cancer and prostate cancer combined.”
From 2015 to 2016 alone, there was a 3.1% increase in death rate for Alzheimer’s. Even more striking is the 9.7% increase in deaths from accidents.
The largest drop, meanwhile, was 11.2% for deaths from pneumonia and influenza.
DEATH CATEGORIES
Globally, deaths for non-communicable diseases are rising and communicable diseases are declining
What exactly is a communicable and non-communicable disease? When it comes to looking at mortality, there are 3 main categories:
- Non-communicable diseases (NCD): Most deaths fall into the NCD group. These are long-term conditions and illnesses which include cancer, cardiovascular & respiratory disease, diabetes, and stroke.
- Communicable diseases: Also described as infectious diseases, Communicable diseases like malaria, HIV/AIDS and tuberculosis are also grouped with maternal & neonatal deaths as well as deaths from malnutrition.
- Injuries: Injuries caused by suicide, homicides, road accidents, deaths by conflict, fire-related accidents, natural disasters and drownings.
♦ Non-communicable diseases (NCD) ♦ Communicable diseases ♦Injuries
Death Count Bar Chart: The bar chart below displays a static death count over the same time frame.
As you can see, most deaths fall into the non-communicable disease category. Communicable disease death totals have been steadily declining since the 1990s. However, the occurrence of epidemics and their relative frequency in the modern era have kept the communicable disease numbers in significant numbers.
Epidemics
An epidemic occurs when infectious diseases spread within an area or population within a specific timeframe or period. The visualization below shows some of the biggest epidemic outbreaks that have spread across our planet over the past two decades.
The recent outbreak of the COVID-19 Coronavirus is the latest in deadly communicable diseases.
COVID-19 Coronavirus Outbreak
The following Coronavirus death data is updated frequently. On March 11, 2020 the WHO classified COVID-19 as a pandemic. The total number of COVID-19 cases, death totals and locations of the deceased are provided below:
Last updated: June 2, 2020
WHEN WILL YOU DIE?
What are the most common ages when people die?
Changes in deaths by age have been pretty significant when looking at the data.
Looking back at 1990, almost 25% of all global deaths were in children under the age of 5 years old.
Fast forward to 2017, and it’s slightly under 10%. When looking at the same time range for ages 70+ years old, deaths have gone from approximately 33% to 50% of total deaths.
Global Deaths by Age Chart: The animated chart below will display the changes in death ages starting in 1990.
Age Groups
The charts below have been broken down into 5 main age groups. These age groups are:
- Under Age 5
- Ages 5 to 14 years old
- Ages 15 to 49 years old
- Ages 50 to 69 years old
- Ages 70 years old and above
What are the causes of death by each age group?
The chart below is organized into an interactive playlist.
Each group is organized into subgroups. Scroll through the age groups and their subcategories which include, locations (countries) and gender. You can also filter the data by year.
Click on the Blue, Red & Green boxes below to observe the data.
- Non-communicable diseases
- Communicable diseases
- Injuries
Most people die when they're old
Most people die when they’re old, however almost half of the 56 million people who died in 2017 were age 70 or older.
Conversely, less than 10% of deaths were from children under 5 years old.
The remaining age groups included 5-14 year olds with 1% of total deaths; 15-49 year olds with 14%; and 50-69 year olds with 27%.
Death rates are falling, but total deaths are increasing. Why?
Let’s look deeper into the specific death categories and their numbers over the years.
- Injuries: Death by injury is the most inconsistent of the three categories. These inconsistencies are typically due to natural disasters and conflicts.
- Communicable diseases: Communicable disease deaths have been on a steady decline since the 1990s. Improvements in medicine and healthcare have contributed to the downward trend of communicable deaths.
- Non-communicable diseases (NCD): Trending upwards, death by non-communicable diseases is responsible for over 73% of worldwide deaths. NCD death have become dominant due an aging population and the decrease of communicable disease deaths.
WORLD CATASTROPHES
Top 10 Deadliest World Catastrophes
Let’s talk about deaths connected with catastrophes around the globe. In this chart, you can see the deadliest world disasters from 1970 to 2017.
The Bhola Cyclone
The worst of those was a storm and flood event which took place on November 11th, 1970 in Bangladesh, and claimed the lives of approximately 300,000 victims. Specifically, this was the 1970 Bhola cyclone.
Along with the aforementioned lives claimed in Bangladesh, this storm and its subsequent aftermath also killed numerous people in India. The surveys that collected data on the injured and dead were also incomplete, ignoring migrant workers and other groups. In fact, the combined death toll may have been a great deal higher than the number you see here.
It is hard to get a complete estimate, because after the initial storm passed, salt had spread into the surface water, rendering it useless. Many people died of thirst who had escaped the initial storm.
The 1976 Tangshan Earthquake
The next disaster you see listed after that in Bangladesh is the July 28th, 1976 Tangshan Earthquake in China, estimated to have claimed the lives of at least 255,000 people.
Tangshan was home to a million people, and was destroyed in minutes. The vast majority of the buildings in the city collapsed, and the city’s infrastructure was devastated. Even though you see here that at least 255,000 people died, this too may be a very low estimate. At the time, there were some analysts who claimed that as many as 655,000 people might have perished.
Even though the damage was concentrated in Tangshan, the effects were felt as far away as Beijing. At least 50 people in Beijing may have died as a result of the quake.
The 2010 Haiti Earthquake
Third on this list is the January 12th, 2010 Haiti Earthquake, which may have killed at least 222,570 victims. Centered close to Léogâne, the magnitude 7.0 quake produced an estimated 52 aftershocks, possibly more, some of them as high as magnitude 4.5.
As with the previous two disasters on this list, there is some debate about exactly how many people died as a result of the earthquake and its aftermath. The number might even be as high as 316,000, according to sources in the government of Haiti. The government also reported that around 280,000 structures were damaged or destroyed.
U.S. MAJOR CATASTROPHES
Now that you have read a bit about some of the world’s deadliest catastrophes, we are going to focus on the worst catastrophes in US history. We’ve broken down the statistics by catastrophe category.
Hurricanes
According to the NOAA National Hurricane Center, the year with the most hurricanes between 1998 and 2017 was 2005. That year, there were 15 hurricanes, 7 of which made landfall in the mainland US, resulting in 1,518 fatalities in total. Not surprisingly, that was the year of Hurricane Katrina.
The second worst year in terms of fatalities was 2017, with 147 deaths. There were 10 hurricanes that year, 4 of which made landfall in the US.
There was actually a year with 0 hurricane fatalities in the US. That was 2006, when there were 5 hurricanes in total, and none of them made landfall in the country.
There were two years with only a single US hurricane fatality. These were 2007 (6 hurricanes in total, 1 which made landfall), and 2013 (2 hurricanes total, neither of which made landfall).
Let’s take a look at the top 10 deadliest hurricanes in US history, examining the most devastating of the catastrophes in detail.
1900 Galveston Hurricane
Thankfully, a great deal of time has passed since the deadliest hurricane in the history of the country, which took place in the year 1900 and struck in Galveston, Texas. The category 4 storm was known locally as the “Great Storm of 1900,” while it was known elsewhere as the “Great Galveston Hurricane.”
The estimated death toll of 8,000 that you see in this chart is the one which turned up most often in government reports at the time. But some estimates were higher, placing the death count as high as 12,000.
More than a quarter of the city’s population was rendered homeless by the storm. Those who still had homes standing universally had repairs to make. The city lost around 7,000 business and residential structures to the hurricane.
In fact, this was a turning point in Texas history. Prior to the hurricane, Galveston was enjoying a Golden Era, and was booming with economic opportunity. But after the hurricane devastated the city, it was Houston that rose to economic prominence.
1928 Okeechobee Hurricane
The second deadliest hurricane in US history to date is the 1928 Okeechobee Hurricane, sometimes referred to as the San Felipe Segundo hurricane.
Along with the devastation it wrought on the Florida mainland, it also caused widespread death and destruction on the Leeward Islands, Puerto Rico, and Greater Antilles and Bahamas.
The Lake Okeechobee region of Florida was hit the hardest on the mainland by the category 4 storm. It is estimated that around 2,500 people died.
2005 Hurricane Katrina
The third deadliest hurricane is one that many of us remember back in 2005, which was Hurricane Katrina. This category 3 hurricane hit Louisiana and Florida, and was particularly devastating to New Orleans.
It wasn’t just the storm which killed people and resulted in widespread property loss, but also problems with the levees of the city. The emergency was also grossly mismanaged by public officials, to the point of prompting resignations at FEMA and NOPD. The disaster resulted in around 1,200 deaths.
As you look over the other entries on our chart of the top 10 deadliest hurricanes in US history, you will notice that the majority of them struck Florida, Louisiana, and other states nearby.
Those who live in the southeast continue to place themselves at an increased risk of death or property loss due to hurricanes.
Tornadoes
Of all the types of natural disasters which claim lives each year, tornadoes arguably fascinate us the most. They are the subject of Hollywood blockbusters, and are avidly pursued by storm chasers.
Perhaps it is the visually striking nature of the tornado which captures our attention—or the wind speeds which can top 100 miles per hour.
Few sights could be as terrifying as one of those dark columns bearing down on us.
In fact, the sheer number of fatalities caused by tornadoes is astonishing when we consider how geographically contained a twister is.
Let’s take a look.
This data on US tornado deaths from 1998 through 2017 summarizes data from the Storm Prediction Center of the National Weather Service.
When you see just how many tornadoes there are every year, it becomes clear why they cause so many annual deaths.
The year with the smallest number of tornadoes was 2014—and that year, there were 886 of them, claiming 47 lives. The year with the largest number of tornadoes was 2008, with 1,692 in all. That year, tornadoes caused 126 deaths.
2011 came in just behind in terms of number of tornadoes, with 1,691 in all—just one fewer than in 2008. Nevertheless, that year was actually far deadlier, with 553 tornado-related deaths across the country.
In fact, that was the deadliest year for tornadoes in the US between 1998 and 2017.
What year had the lowest tornado-related death count? That would be 2016. Even though there were 971 tornadoes that year, there were only 18 tornado deaths.
Now you might be wondering geographically where tornadoes tend to touch down across the US.
The chart above answers that question for 2017 with data from the Storm Prediction Center.
The state with the largest number of tornadoes that year was Texas, with 176 in all. Texas was followed by Georgia, which came in second with 131 tornadoes. Missouri took third place with 102 tornadoes.
These states were followed in order by Louisiana, Mississippi, Kansas, Alabama, Illinois, Oklahoma and Iowa.
As a matter of interest, despite Texas having significantly more tornadoes in 2017 than Georgia, it had far fewer deaths. Only 4 people died because of tornadoes that year in TX, whereas 16 people died in GA because of tornadoes in 2017.
The Storm Prediction Center also has provided sufficient data to compile a chart which displays total tornadoes and related deaths by state for 2017.
You can view the data for all 50 states in the chart. You’ll see that in total, there were 35 tornado deaths across the country that year, and 1,522 tornadoes in total throughout the states.
Earthquakes
We’ve talked about storm fatalities in the US. Now let’s take a look at how many people are killed by earthquakes in the country.
This insurance data provides us with insights into losses incurred financially and in terms of loss of life from earthquakes spanning as far back as 1906.
In fact, that 1906 earthquake is the deadliest one on this list, with a total of around 3,000 fatalities. It took place in San Francisco, Santa Rosa and San Jose, and resulted in the equivalent of $4,499 million dollars worth of damage when adjusted for inflation.
Also particularly deadly was the March 27th-28th 1964 earthquake which struck Alaska. This one resulted in 131 fatalities.
Fires
How many people die because of fires in the US?
The data you see in this chart comes from the National Fire Protection Association (11), and summarizes how many people were injured or killed in various types of fires during the year 2017.
Note that firefighters (non-civilians) who were killed or injured in the line of duty are excluded from this data.
From this data, you can see that 80% of all fire-related deaths occur in residential blazes. During 2017, residential fires accounted for 2,710 civilian fire deaths and 10,910 civilian fire injuries.
Of these deaths and injuries, the vast majority occurred in 1- and 2-family homes, with a far smaller percentage taking place in apartments and other residential structures.
Interestingly, there was a 30% drop in non-residential structure fire injuries and deaths from 2016 to 2017. 105 people died in these types of fires, and 1,250 were injured.
A larger proportion of fire deaths and injuries took place in highway vehicles, of which there were a 43% increase year-over-year. In total, 400 civilians died in highway vehicle fire incidents, and 1,370 were injured.
There was a 60% drop in fire-related incidents of this nature in other types of vehicles, with only 30 related deaths and 240 related injuries.
Finally, 145 people died and 900 were injured in all other types of fires.
In this chart, you can see the deaths from fire incidents which resulted specifically in multiple fatalities in the year 2017.
The worst incident on the list was the California wildfires, which resulted in 44 deaths during the month of October. This event was referred to as the “Northern California Firestorm,” the “North Bay Fires,” and the “Wine Country Fires.”
In all, this firestorm consisted of 250 separate wildfires, twenty-one being classified as major fires, each resulting in the destruction of 245,000 acres of land or more.
This was not a natural disaster. The weather conditions did play a role in the fires, but investigations traced the origins of all but one of the fires to equipment owned by Pacific Gas & Electric (PG&E).
Following the California wildfires, the next most catastrophic multiple-death fire event in 2017 took place in December in New York, where a blaze in a five-floor apartment building resulted in 13 deaths.
Ranking behind the apartment fire in NY, the next most devastating event in terms of fatalities took place in a single-family home in Ohio in May that year. The house fire killed 7 people.
Coming in fourth-seventh on the list (in no particular order) were a series of unrelated house fires in Maryland, Oregon, Texas and Illinois, each of which killed six people.
The rest of the events on the list all killed five people each, and occurred in a variety of states. Most of the fires were in single-family homes, but some were in apartment buildings, and one took place in a corn milling plant in Wisconsin.
We have gone over the deadliest types of fires in 2017, but what are the deadliest fires overall in US history?
The deadliest fires in US history
Click the image above to begin slideshow
September 11th Terrorist Attacks
The most devastating multiple-death fire in the history of the United States took place on September 11th, 2001, when terrorists attacked the World Trade Center in New York City.
Initially, 2,666 deaths were reported. Later, government officials revised that estimate to 2,976.
We will go into further detail on the September 11th attacks in the next section on terrorism.
The SS Sultana Explosion
The second deadliest fire in US history took place on April 27th, 1865. The Sultana was a steamboat that was supposed to only carry a maximum of 376 passengers at a time.
Owing to political events at the time, the ship was loaded with 2,137 recently released prisoners of war. This was never supposed to happen—but certain people looking to make as much money as possible ferrying the prisoners up the river decided to ignore regulations.
So, when the boilers onboard blew up, many, many more people perished than should have ever been possible onboard the boat.
Indeed, the fact that the boat was overloaded in the first place actually was part of what led to the issues with the water levels that caused the boilers to explode.
In all, there were 1,547 deaths recorded, all of them entirely preventable. In spite of how catastrophic the explosion was, nobody legally was held responsible.
Peshtigo Forest Fire
The third deadliest fire in US history took place on October 8th, 1871. The blaze known as the Peshtigo fire burned on the Door Peninsula in northeastern Wisconsin, extending into the Upper Peninsula of Michigan. It was also spread over a section of Wisconsin directly across the water from the Door Peninsula.
Over the course of the disaster, around 1,200,000 acres burned, and deaths were estimated at around 1,152. There are some estimates which suggest that as many as 2,500 people might have died. If that is true, it would rank directly behind the September 11th terrorist attacks in terms of fire-related fatalities.
By coincidence, the Great Chicago Fire happened that day as well. Being a major urban disaster, the fire in Chicago received far more attention than the one in Wisconsin, to the point where most people are not even aware that the WI fire happened. Nonetheless, the Great Chicago Fire doesn’t even make this top ten list. Around 300 people died in that fire—fewer than the 361 deaths tallied for the coal mine explosion in Monongha, WV in 1907 which comes in tenth on the list.
You can learn more about the remaining disasters on this list by looking at the graphic below.
Terrorism
The most devastating terrorist acts to happen on US soil are the aforementioned September 11th, 2001 attacks.
On that day, terrorists flew airplanes into the World Trade Center in NYC and the Pentagon in Washington DC.
The total casualties for both attacks (including those who died in the airplanes) were estimated at 2,823.
The fires burned at the WTC as hot as 2,300 degrees Fahrenheit, and some of them continued to burn for 69 days underground (2). It took 230 days to dig for body parts, 19,500 of which were collected. Only 291 corpses were found intact. 1,300 children became orphans as a result of the attacks.
In 1999, EgyptAir Flight 990 (MS990/MSR990) went down in the Atlantic Ocean (in international waters, though not far from Nantucket), resulting in the deaths of all 217 people onboard.
Whether or not the crash was deliberate is contested. The National Transportation Safety Board (NTSB) in the US concluded that the crash was “a result of the relief first officer’s flight control inputs. The reason for the relief first officer’s actions was not determined.” Authorities in Egypt insist that the crash must have been an accident. To this day, nobody knows the truth.
The third most deadly terrorist attack (this one confirmed) that took place in the US was the Oklahoma City bombing in 1995 by Timothy McVeigh and Terry Nichols. The attack on the Alfred P. Murrah Federal Building resulted in an estimated 168 deaths and 680 injuries, and was in part a response to the deadly raid of a cult in Waco, TX.
Gun Deaths
While reading about deaths from terrorism, you might be wondering about deaths which are related to firearms.
The chart you see below provides statistics which came from the National Safety Council, and covers gun-related deaths from 2015 and 2016.
As you can see, the most common way that people die by firearms is at their own hands. In 2015, there were 22,018 suicides using firearms. That number rose to 22,938 firearm suicides in 2016.
There are significantly fewer homicides using firearms than suicides, but still quite a few.
In 2015, 12,979 people were killed in homicides using firearms. That number took a jump to 14,415 in 2016.
How many people does the law gun down every year? In 2015, law enforcement officials killed 484 people with firearms. In 2016, they gunned down 510 people.
The numbers are similar for fatalities resulting from accidental discharges. In 2015, 489 deaths resulted from accidental discharges. That number rose marginally to 495 in 2016.
Finally, the number of gun deaths involving “undetermined intent” were 282 in 2015, and 300 in 2016.
In total, 36,252 people died by firearms in 2015, and 38,658 died by firearms in 2016.
Drug Overdoses
Now, let’s take a look at how many people die as a result of drug overdoses.
United States Drug Overdoses
In the chart above, you can see how many drug overdose deaths there were for every state during 2016. Here are some figures which stand out:
- Florida: 4,728 deaths
- California: 4,654 deaths
- Pennsylvania: 4,627 deaths
- Ohio: 4,329 deaths
If you look at the “deaths per 100,000” column, some of these stats are also noteworthy. For example, in Pennsylvania, drug overdoses reportedly account for 37.9 deaths per 100,000.
While the states above have a large number of drug overdoses, there are some states which stand out for the opposite reason—because they have so few:
- Wyoming: 99
- North Dakota: 77
- South Dakota: 69
Not surprisingly, these are fairly remote locations. Not only do they have a lower population density, but they may also have lower access to drugs. Major metropolitan regions are more likely to be well-supplied with illicit substances, particularly those with major highways connecting cities (i.e. California, with its drug-running routes up and down the coast).
The Opioid Crisis
If you are a health professional or a pain patient, you probably are well aware of the opioid crisis and the complex issues surrounding it.
But if you are not well-acquainted with the crisis, you may not be aware of how devastating its toll has been.
This chart shows the number of drug overdose deaths between 2000 and 2016 caused by heroin, opioid medications, and drugs in general.
You can see clear increases in all three. In 2000, opioids overdoses led to 8,407 deaths. By 2016, there was a 66% increase in that number.
The CDC reports, “From 1999 to 2017, more than 700,000 people have died from a drug overdose. Around 68% of the more than 70,200 drug overdose deaths in 2017 involved an opioid … On average, 130 Americans die every day from an opioid overdose.”
The opioid issue is a complex one. There are some patients who can only get relief from opioid medications. But opioids have been vastly over-prescribed, with many patients receiving them before other treatment options have been exhausted.
It is also common for high doses to be prescribed, even when lower ones might suffice. When a patient receives a high dose for a short span of time, they are 40 times more likely to develop a use disorder than they would be if they received a low dose for a short period of time.
Since the opioid crisis has come into the spotlight, many patients have had their supplies cut off abruptly.
For some, this has resulted in intense suffering (both from withdrawal and the lack of a new treatment), with some patients even turning to suicide for relief.
Nonetheless, the overdose deaths highlight the damage of widespread opioid overuse going unchecked.
Aviation
World Aviation Losses
Airline transportation increases the speed and convenience of travel. But many people are afraid of flying.
Global Aviation Deaths
If you have ever wondered how many fatalities are caused by aviation crashes, the chart below will inform you of the deadliest aviation crashes around the world throughout history.
The most deadly aviation crash in history didn’t happen in the air. It took place on the ground, specifically the runway at the Los Rodeos Airport at Tenerife in the Canary Islands.
Two Boeing 747 planes were involved, KLM Flight 4805 and Pan Am Flight 1736.
The collision between the two craft on the runway was a result of fog and overcrowding. The latter was itself the consequence of diverted flights from the Gran Canaria Airport due to a terrorist incident. The collision resulted in the deaths of 583 people.
The second deadliest aviation disaster took place on August 12th, 1985. Japan Airlines Flight 123 went down around 62 miles from Tokyo due to rapid decompression. The disaster on the Boeing 747SR killed 520 people.
If you want to learn more about the rest of the world’s deadliest aviation crashes, you can research the rest of the incidents listed in this chart. Airlines involved in the remainder of the crashes include Saudi Arabian Airlines (both the third and sixth deadliest aviation crashes), Kazakhstan Airlines, Turkish Airlines, Air India, Malaysia Airlines, Iran Air, the Islamic Republic of Iran Air Force and American Airlines.

Motor Vehicle Deaths
While many people are more afraid of getting in an airplane than they are of hopping into a car, the reality is that far more people die in car crashes each year than die in aviation accidents.
In fact, we can best capture a picture of motor vehicle deaths by looking at a variety of statistics.
Traffic Deaths
We can begin by taking a look at this chart of traffic deaths spanning the years 2008 through 2017.
You can see by looking at the number of fatalities for each year as well as the annual percent change that the motor vehicle deaths are pretty consistent overall.
The largest percentage changes happened between the years of 2008/2009, and 2014/2015.
In 2008 and 2009, there were significant drops in fatalities. In 2014 and 2015, there was a significant rise.
Motor Vehicle Crashes, 2007-2016
In this chart, you can see the total number of fatal vehicle crashes for the years spanning 2007 through 2016. Along with this data, you can also see the number of injuries that occurred from crashes.
As you can see, the vast majority of crashes on any given year do not result in fatalities, but injuries are much more common.
Motor Vehicle Traffic Deaths By State
Ever wondered whether you are living in a state where you have a high chance of dying in a traffic accident?
Motor Vehicle Traffic Deaths By State 2017
When comparing data from 2016 and 2017, the total number of deaths changed for every state in the US.
In 2016, the worst state to live in for vehicle traffic deaths was California, with a total of 3,837 deaths. Not far behind California was Texas, with a total of 3,797 deaths. Coming in third was Florida, with a total of 3,176 deaths.
In 2017, the order reversed between Texas and California, with Texas having the most motor vehicle deaths, a total of 3,722 in all. The number of vehicle deaths in California that year dropped to 3,602. As for Florida, the number dropped slightly to 3,112.
Other states with large numbers of motor vehicle deaths include Arizona, Georgia, Illinois, Michigan, New York, North Carolina, Ohio, Pennsylvania, South Carolina, and Tennessee.
What about states where motor vehicle deaths are less common?
Here are a few places where you are less likely to be involved in a fatal motor accident:
- Alaska: 84 deaths in 2016 and 79 deaths in 2017.
- Delaware: 119 deaths in both 2016 and 2017.
- Washington DC: 27 deaths in 2016 and 31 deaths in 2017.
- Hawaii: 120 deaths in 2016 and 107 deaths in 2017.
- Maine: 160 deaths in 2016 and 172 deaths in 2017.
- Montana: 190 deaths in 2016 and 186 deaths in 2017.
- New Hampshire: 136 deaths in 2016 and 102 deaths in 2017.
- North Dakota: 113 deaths in 2016 and 115 deaths in 2017.
- Rhode Island: 51 deaths in 2016 and 83 deaths in 2017.
- South Dakota: 116 deaths in 2016 and 129 deaths in 2017.
- Vermont: 62 deaths in 2016 and 69 deaths in 2017.
- Wyoming: 112 deaths in 2016 and 123 deaths in 2017.
You will notice that most of these states where motor vehicle deaths are less common are either geographically small or have a low population density.
While deaths rose in some states from year to year and fell in others, there was an overall percentage change of -1.8% from 2016 to 2017 for all states combined.
Vehicles Involved In Fatal Crashes By Vehicle Type And Crash Severity, 2007 And 2016
Have you ever wondered what types of vehicles are most likely to be involved in fatal crashes? The chart below shows you statistics for passenger cars, light trucks and motorcycles for 2016 and 2007.
In 2016, marginally more passenger cars (20,839) than light trucks (20,069) were involved in fatal accidents. Both figures are down significantly from the numbers in 2007. That year, 21,810 fatal crashes involved light trucks and 22,856 fatal crashes involved passenger cars.
In terms of rate per 100,000 registered vehicles, there was a much larger drop in fatal crashes involving light trucks than passenger cars between 2007 and 2016.
The rate for passenger vehicle fatal accidents declined from 16.57 in 2007 to 15.45 in 2016.
The more sizable decrease for fatal accidents involving light trucks was a drop from 21.63 to 15.20.
Moving onto motorcycles, there was a slight increase in the number of fatal crashes which involved them between 2007 and 2016.
In 2007, the number of fatal crashes involving motorcycles was 5,306. In 2016, it was 5,421.
Motor Vehicle Deaths By Activity Of Person Killed, 2016
Who would most likely be killed if you got into a traffic accident? This chart shows you the percentages of persons killed in motor vehicle accidents in different roles.
It turns out that if you get into a fatal accident as the driver, the person who is most likely to die is you or another driver involved in the accident.
In 2016, 49.7% of motor vehicle deaths consisted of drivers.
17.1% of motor vehicle deaths that same year were passengers, and 16% were pedestrians.
The next largest group were motorcycle riders, accounting for 14.1% of motor vehicle deaths.
The remaining people killed consisted of pedalcyclists, “unknown occupants,” and “other” persons.
Sex Of Drivers Involved In Crashes, 2007-2016
Who is more likely to be a driver in a fatal crash, a male or female person? Here you can view data spanning the years 2007 through 2016.
The gap between the two every single year is somewhat astonishing.
For example, 40,764 drivers in fatal crashes were male in 2007, versus 14,101 who were female in the same year.
In 2016, 37,352 drivers in fatal crashes were male, whereas only 13,208 were female.
This data comes from the US Department of Transportation. If you’re wondering, the numbers are similar at least in some other countries.
For example, The Guardian reports, “The difference between men and women behind the wheel was brought into sharp relief this week when new Home Office figures revealed men are guilty of a staggering 97% of dangerous driving offences and 94% of accidents causing death or bodily harm. On average, men committed nine times as many traffic offences as women.”
What are the reasons for this stark gap?
The Guardian article quotes transport psychologist Steve Stradling as saying, “It could be a mixture of differences in hormones, brain structure, and cultural pressures.”
But the article also points out that men consist of a larger proportion of drivers on the road, and that they also tend to drive longer distances.
If adjustments were to be made for these differences in time and distance spent on the road between males and females, it would at least partly close the gap.
Drivers In Fatal Motor Vehicle Crashes By Age, 2016
Next, you might be wondering whether younger drivers really are more dangerous than their older counterparts, as would seem intuitive.
Here, the statistics do bear out evidence that this perception is correct. In this chart, you can see the number of licensed drivers for each age group, the percentage of drivers they comprise, how many were involved in fatal crashes, and their involvement rate in 2016.
The age group with the highest involvement rate in fatal crashes is indeed the 16 to 20 age group. Even though licensed drivers in this group account for only 5.4% of total drivers, their involvement rate per 100,000 licensed drivers in fatal crashes is 36.76.
The group with the second highest involvement rate is the 21 to 24 age group. Drivers in this group comprises only 6.5% of the total licensed drivers, but their involvement rate in fatal crashes is 36.19.
The group with the third highest involvement rate is the 25 to 34 age group, but here, we see a significant decline. Drivers in this age group account for 17.7% of total licensed drivers, and have an involvement rate of 27.59 in fatal crashes.
Involvement rates continue to drop along with increases in age. The involvement rate in crashes for those in the 35 to 44 age group is 22.24. For those in the 45 to 54 age bracket, it is 20.16.
The group with the lowest involvement rate is the 65 to 74 age bracket. Drivers in this age group consists of 11.8% of those on the road, and have a 15.81 involvement rate in fatal crashes.
This is a surprising contrast with the perception that older drivers are unsafe. It seems that drivers only become less safe when they enter the over-74 age group, when the involvement rate jumps back up to 19 for fatal crashes.
At this point, however the percent of licensed drivers consisting of that age group drops to 7.1%.
This likely reflects both the lower overall percentage of the population that is alive past the age of 74 and some drivers having their licenses revoked for age-related reasons.
Nonetheless, when you compare the over-74 statistics to those for the 16 to 20 and 21 to 24 age brackets, it is quite clear that old drivers are safer than young ones, and you are significantly less likely to be involved in an accident with a driver over the age of 74 than one under the age of 25 even with those younger drivers likewise representing a small percentage of total drivers on the road.
Driving Behaviors Reported For Drivers And Motorcycle Operators Involved In Fatal Crashes, 2016
What is it that causes most fatal crashes on the road? In this chart, you can see 2016 data on the number of fatal accidents which involved various behaviors and mistakes as well as the percentage of such crashes that they accounted for.
Breaking speed limits accounted for the largest percentage of fatal accidents on the road in 2016. There were 9,234 in all, consisting of 17.8% of fatal crashes.
The next largest category of accidents involved driving under the influence. This caused 5,592 fatal crashes, which accounted for 10.8% in all.
3,890 fatal driving accidents involved drivers using the wrong lane. That accounted for 7.5% of fatal crashes in 2016.
Drivers refusing to yield the right of way contributed to 7% of fatal crashes in 2016.
6.2% of fatal crashes that year involved one form of distraction or another, and 5.2% involved “operating the vehicle in a careless manner.”
You can read to the chart in detail to view other behaviors that contributed to fatal motor vehicle accidents in 2016.
You probably are curious to know more about some of these contributing behaviors, so below, we will talk about distracted driving and DUI-related deaths.
Fatal Crashes Affected By Distracted Drivers, 2016
It is easy to feel that cell phone laws are draconian. But just how dangerous are mobile devices on the road, and how deadly is distracted driving overall?
In 2016, only 1% of the 34,439 fatal motor vehicle accidents involved the use of cell phones.
It would be easy for some drivers to blow that percentage off, but let’s take a closer look.
In 2016, there were 37,461 fatalities involved in automotive accidents.
Distracting factors were involved in 3,157 crashes involving 3,210 drivers and producing 3,450 fatalities. That is a total of 9% of all fatal crashes and all fatalities involved in motor vehicle accidents that year.
14% of such incidents involved the use of cell phones.
That accounts for 444 crashes involving 457 drivers and producing 486 fatalities.
Those are all fatalities that might not have occurred had somebody not been distracted by their cell phone while driving.
It is well worth it to prevent hundreds of fatal motor accidents every year by observing cell phone laws on the road. There is nothing draconian about saving lives.
So, next time you’re tempted to text or call while driving, think about those hundreds of deaths per year, and put away your mobile device.
These numbers also highlight how important it is to drive as distraction-free as possible in general.
DUI Deaths
Now, let’s take a look at deaths which were related to driving under the influence.
Alcohol-Impaired Crash Fatalities, 2008-2017
In this visual, you can examine statistics pertaining to alcohol-impaired crash fatalities from the year 2008 through 2017.
The numbers are pretty consistent, ranging between 9,000 and 12,000, accounting for anywhere from 29% to 32% of all crash deaths.
In other words, every year, close to a third of all motor accident deaths involve alcohol.
Needless to say, this is a sobering statistic.
Percent Of Alcohol-Impaired Drivers Involved In Fatal Crashes By Age, 2008 And 2017
What age group is most likely to be involved with alcohol-impaired fatal crashes?
Here, you can view data for the years 2008 and 2017. Needless to say, this is a sobering statistic.
You can see that the age group where alcohol-related fatal crashes are most common is among those aged 21 to 24.
In 2008, 34% of alcohol-impaired drivers involved in fatal crashes were in that age group, a number which dropped to 26% in 2017.
This is perhaps unsurprising for a couple of reasons. First of all, younger drivers tend to be involved in more fatal crashes in general. Secondly, age 21 is when alcohol consumption becomes legal.
So, it should not be surprising if we see the most reckless behavior in this age group that finally is able to legally drink.
Nonetheless, even before the legal age of alcohol consumption, driving under the influence is common. The percentage of alcohol-impaired drivers in the 16 to 20 age group who were involved in fatal crashes was 17% in 2008 and 15% in 2017.
The age bracket with the second-highest percentage in both 2008 and 2017, however, is 25 to 34.
In that age group, 31% of alcohol-impaired drivers in 2008 were involved in fatal crashes, and 26% in 2017.
There is a significant drop for the 35 to 44 age group, with reductions for each older age bracket after that.
By age 55, drivers are finally less likely to be involved in fatal crashes while under the influence than they were when they were in the 16 to 20 age group.
12% of drivers aged 55 to 64 in 2008 were involved in fatal crashes. That percentage increased to 15% in 2017.
Even fewer drivers in the 65 to 74 age bracket were involved in fatal crashes while under the influence of alcohol. The numbers were just 6% in 2008 and 9% in 2017.
The numbers were, predictably, lowest for the over-74 age group. Only 4% of alcohol-impaired drivers in 2008 in that age bracket were involved in fatal crashes, and just 6% in 2017.
Interestingly, there were decreases across the board from 2008 to 2017 for the younger age groups. But for the three oldest groups, there were increases.
Persons Killed In Total And Alcohol-Impaired Crashes By Person Type, 2016
Now let’s take a look at statistics from the year 2016 concerning the roles of people involved in alcohol-impaired crashes which resulted in fatalities.
That year, a total of 18,610 drivers were killed in automotive crashes. 6,067 of those were killed in alcohol-impaired crashes, accounting for 33% of the total.
A similar percentage of passengers killed that year died in alcohol-related accidents—29%.
With motorcyclists, the percentage in question is 30%, so again, very similar.
In 2016, 5,987 pedestrians were killed, 807 of them in alcohol-related accidents, accounting for 13% of the total number. Alcohol-related crashes accounted for 11% of pedalcyclist auto crash deaths that year. For people with an “other/unknown” role, 20% of automotive crash deaths could be attributed to alcohol-related accidents.
Recreational Related Deaths
We have talked about death statistics involving automotive accidents as well as plane crashes.
Most people do not use boats as a major form of transportation anymore, but they still get on watercraft for recreational purposes.
So, let’s take a look at recreational watercraft accidents which have resulted in injuries or deaths. In this chart, you can see both accidents and fatalities for the years 2013 through 2017 involving recreational watercraft.
Recreational Watercraft Accidents, 2013-2017
The total number of accidents from year to year is pretty similar. The lowest number of watercraft accidents was in 2013, adding up to 4,062 in total.
2014 was quite similar, with 4,064 recreational watercraft accidents, just two more then there were the year previous.
Accidents increased in 2015 and 2016 before decreasing again in 2017. The year with the most recreational watercraft accidents was 2016, with 4,463 in all.
For all five of those years, you will notice that more than 300 total recreational watercraft accidents involved alcohol.
Every year, more than 500 fatalities resulted from recreational watercraft accidents. The year with the fewest deaths was 2013, with 560 dead. The year with the largest number of deaths was 2016, with 701 fatalities.
In all five of these years, more than 2,500 people were injured in these types of accidents, and every year, property damage exceeded $39 million.
The only year where alcohol use did not result in more than 100 fatalities in recreational watercraft accidents was 2013, when it was involved in 94 fatalities.
The year when it was involved in the largest number of fatalities in recreational watercraft accidents was 2014, 137 in all.
You may be wondering what types of watercraft are most likely to be involved in accidents. 46%, nearly half, are open motor boats. The remaining types of vehicles are jet skis and cabin motorboats.
You also may be wondering about how people tend to die in these types of accidents. For more than three quarters, the answer is drowning, and of these fatalities, those not wearing life jackets accounted for 85%
The message is clear. If you do not want to be the victim of a watercraft accident, you can reduce your chances by avoiding alcohol and wearing your life vest.
Top 10 States By Recreational Watercraft Accidents, 2017
Now, you might be interested in knowing what states have the largest number of recreational watercraft accidents. To answer that question, let’s take a look at the statistics from 2017.
Topping the list is Florida with 723 accidents resulting in 66 deaths, 429 injuries and more than $8 million in property damage.
This not only makes it the state with the largest number of recreational watercraft accidents, but also the deadliest, most injurious, and most expensive for these types of accidents.
The state with the second largest number of recreational watercraft accidents is California.
In that state, there were 350 accidents in 2017 related to recreational watercraft. Interestingly, that number is significantly less than the number of accidents in Florida, which were more than double that amount.
Nonetheless, there were nearly as many deaths in California as there were in Florida—50 in all versus 66 in Florida. But there were far fewer injuries—just 249 versus 429 in Florida. Total property damage was less than $3 million.
There is another sharp drop to the state with the third largest number of recreational watercraft accidents. There were 170 accidents in Texas of this nature, resulting in 100 injuries. Even though there were significantly fewer accidents in Texas than in California, there was a larger death toll at 63—almost as many as in Florida.
Other states where there were large numbers of recreational watercraft accidents included New York, South Carolina, Maryland, Missouri, Arizona, North Carolina, and Ohio.
You will notice that there are multiple landlocked states that make this top 10 list. In fact, landlocked Arizona had 123 such accidents compared to North Carolina’s 117.
The state with the lowest number of fatalities however was Maryland. Even though there were 147 recreational watercraft accidents in 2017 in that state, they resulted in only six deaths.
Home Deaths
Most of the types of deaths we have discussed involve accidents that take place outside the home.
But if you die in your home from an unintentional injury, what is the most likely way that you will perish?
Principal Types Of Home Unintentional Injury Deaths, 2015
Most of the types of deaths we have discussed involve accidents that take place outside the home.
But if you die in your home from an unintentional injury, what is the most likely way that you will perish?
The information you see here comes from the National Safety Council. In the year 2015, 74,600 deaths resulted from unintentional injuries in the home.
More than half of those (53.1%) were the result of fatal poisoning, adding up to 39,600 deaths at all.
This certainly drives home the recommendation to keep toxic substances out of reach of children and others who might not be able to adequately see to their own safety.
The next most common cause of death in the home resulting from unintentional injury is falling. In 2015, 21,100 people died this way, accounting for 28.3% of all of these types of deaths.
Choking, for example by eating improperly, resulted in 2,600 fatalities, making it the third most common identified cause of unintentional injury-related deaths in the home. But it accounted for only 3.5% of these deaths, which is quite a drop from the 28.3% accounted for by falling.
Coming in just behind choking were deaths from fire, flames or smoke, followed by death by drowning.
Finally, 10.3% of all unintentional injury deaths in the home in 2015 fell into the category of “other.” That was 7,700 deaths in all.
So, if you do die in the home, statistically speaking, it will very likely be by poisoning or by taking a spill.
Workplace Deaths
Finally, while many people die in the home or while driving to or from the home, workplace deaths are common as well. Let’s take a look at some statistics relating to how people tend to die on the job.
Workplace Losses And Deaths, 2007-2016
These statistics span the years from 2007 through 2016, and tell you how many workers died during each of these years as well as the economic losses associated with those workplace deaths.
You will notice right away that some of the largest numbers of workplace deaths have fallen during recent years.
In 2014, there were 4,132 workplace deaths, and in 2015, there were 4,190. The largest number of deaths reported was in 2016, 4,398 in all.
But workplace deaths were even higher back in 2007 and 2008, when they were 4,829 and 4,423 respectively. That makes 2007 the deadliest year for workers in this range of years.
Workplace Deaths By Selected Cause, 2015-2016
What are some of the most common ways that people die on the job? Let’s take a look at data for 2015 and 2016 from the Bureau of Labor Statistics.
Unsurprisingly, the vast majority of workplace deaths are the result of transportation accidents, many which fall under the category of vehicle crashes.
In 2015, 2,054 workplace deaths were the result of transportation accidents, a number which jumped up to 2,083 a year later. These accidents accounted for 40% of workplace deaths.
Of those transportation accidents, vehicle crashes accounted for 24% of workplace deaths.
Also unsurprisingly, one of the next largest categories was falls—just as it is in the home.
Falls accounted for 16% of workplace deaths, 800 of them in 2015 and 849 of them in 2016.
17% of workplace deaths resulted from assaults. While the number of assaults resulting in deaths in the workplace in 2015 was lower than the number falls (703 versus 800), assaults and violence accounted for a greater number of workplace deaths than falls in 2016 (866 versus 849).
The subcategory of homicides accounted for 10% of deaths in the workplace. Another 10% of deaths were the result of “exposure to harmful substances or environments.” Accidents involving “contact with objects and equipment” resulted in 15% of workplace deaths.
Only 2% of all workplace deaths resulted from fires or explosions, making it by far the smallest category of workplace fatality causes.
Resources & References
- http://www.ecology.com/birth-death-rates/
- The Guardian
- The Centers for Disease Control and Prevention
- U.S. Department of Labor, Bureau of Labor Statistics, Census of Fatal Occupational Injuries
- Global Health Data Exchange
- National Center for Health Statistics
- National Oceanic and Atmospheric Administration, National Hurricane Center
- Storm Prediction Center of the National Weather Service
- 2018 Munich Re, NatCatSERVICE; Insurance Information Institute
- Swiss Re
- https://www.nfpa.org/News-and-Research/Data-research-and-tools/US-Fire-Problem
- National Fire Protection Association
- National Safety Council
- NCHS, National Vital Statistics System, Mortality
- Bureau of Aircraft Accidents Archives
- U.S. Department of Transportation
- National Highway Traffic Safety Administration
- Federal Highway Administration (FHWA)
- United States Coast Guard
- National Safety Council
- U.S. Department of Labor, Bureau of Labor Statistics